One test could change your life.
The right testing tells you what’s wrong. We tell you how to fix it.
One test could change everything
Most people just haven't had the right one.
Not All Lab Work Is Equal
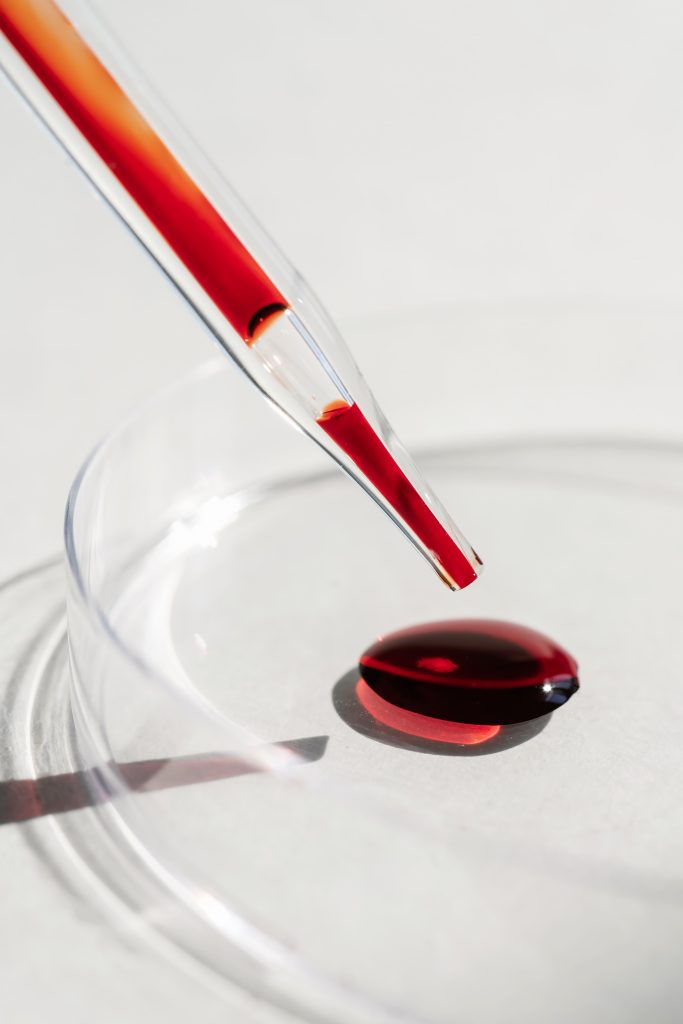
The testing method your clinic uses determines how accurate your results are. Most clinics use the cheapest option available, and when your numbers are off, every decision that follows is based on bad information.
For hormones like testosterone and estradiol, accuracy depends on the testing method. Most clinics use immunoassay because it is cheaper and faster. It is also less reliable at the exact ranges where treatment decisions are being made. LC-MS/MS is the methodology used in clinical research, and it is what we use.

Inflated Panel Counts
Some clinics advertise 100+ biomarkers but pad the number with calculated values derived from other results. A calculated marker is not a test. It is a math equation applied to a test you already paid for, and most clinics do not disclose which markers are measured or estimated.

Tech Company or Clinic?
The biggest names in this space are tech companies with some sort of "health" feature. Their product, a dashboard, an app, a health score all fail to do anything meaningful. The clinical relationship, if it exists at all, is an add-on. A dashboard does not evaluate your symptoms, interpret your labs in context, or adjust your treatment when something changes. A medical professional does.
Why This Matters To You
When was the last time you had blood work done? Not a basic panel at a checkup, but a comprehensive look at what is actually happening inside you.
A serious problem can develop without a single symptom to warn you. Comprehensive blood work is how it gets caught while it is still manageable.
Doing Good begins with knowing betterStart Protocol
More than markers
Every Result Reviewed by a Clinician
Your panel is ordered under physician authorization, and a clinician reviews every value that comes back. In your written evaluation or video visit, your licensed medical provider explains what they mean for your health and your goals and builds your treatment plan with you.
Access to Treatment
Your blood work opens access to our full prescribing formulary. Testosterone, GLP-1 medications, peptides, and more. If your labs indicate that treatment is appropriate, your provider can prescribe during the same consultation.
No Subscriptions or Membership Plans
You pay for your panel and your treatment. There are no monthly memberships, no recurring charges, and no platform fees. When you need follow-up labs or a refill, you order what you need.
Every marker, categorized.
Browse by body system. Filter by tier to see exactly what you get on each panel.
Hematology Blood 9 markers Markers describing red and white cell counts and oxygen-carrying capacity.

Hematocrit
The share of your blood made up of red blood cells.
The percentage of your blood volume taken up by red blood cells.
High readings can mean dehydration, sleep apnea, or testosterone therapy; low readings point to anemia. Dehydration falsely raises it, and pregnancy tends to lower it.
Red Blood Cells
The cells that carry oxygen from your lungs to the rest of your body.
The total number of red blood cells in your blood.
High counts can come from dehydration, smoking, low-oxygen conditions, or testosterone therapy, while low counts point to anemia from blood loss or nutrient shortfalls. Hydration and altitude move the number.
Hemoglobin
The iron-rich protein inside red blood cells that carries oxygen.
The amount of hemoglobin in your blood, which sets your oxygen-carrying capacity.
High levels track with dehydration, smoking, or low-oxygen states, while low levels signal anemia from blood loss, nutrient deficiency, or chronic illness. Altitude, pregnancy, and hydration affect it.
Mean corpuscular volume (MCV)
A calculated value for the average size of your red blood cells.
The average size of a single red blood cell.
Large cells suggest B12 or folate deficiency, alcohol, or liver issues, while small cells suggest iron deficiency or thalassemia. When two deficiencies overlap, the average can look falsely normal.
Mean corpuscular hemoglobin (MCH)
A calculated value for the average amount of hemoglobin in each red blood cell.
The average amount of hemoglobin carried by a single red blood cell.
High values track with larger cells from B12 or folate deficiency, while low values track with iron deficiency, where cells are small and pale.
Mean Corpuscular Hemoglobin Concentration (MCHC)
A calculated value for how concentrated the hemoglobin is inside your red blood cells.
How tightly hemoglobin is packed within each red blood cell.
Low values point to iron deficiency or thalassemia. Genuinely high values are rare and usually reflect a lab artifact like clumped cells or fatty blood.
Red cell distribution width (RDW)
A calculated value showing how much your red blood cells vary in size.
The range of sizes across your red blood cells.
High values flag a mix of sizes, often an early sign of iron, B12, or folate deficiency before anemia shows. Very uniform cells give a low, usually unremarkable result.
Platelet Count
Tiny cell fragments that help your blood clot and wounds heal.
The number of platelets in your blood.
High counts can come from inflammation, infection, or iron deficiency, while low counts raise bleeding risk and may follow bone marrow suppression, autoimmune destruction, or liver disease.
Mean Platelet Volume (MPV)
A measurement of the average size of the platelets circulating in the blood, which reflects how rapidly the bone marrow is producing and releasing them.
The average size of a single platelet.
Larger platelets mean the marrow is actively producing fresh ones, often to replace platelets being destroyed, while smaller, older platelets suggest the marrow is underproducing.
Cardio-metabolic Insight Cardiovascular 20 markers Markers that help frame lipid balance, inflammation, and cardiovascular risk.

Cholesterol, Total
A waxy fat your body needs for cell walls, hormones, and vitamin D.
The sum of all cholesterol carried in lipoproteins: LDL (low-density lipoprotein), HDL (high-density lipoprotein), and VLDL (very low-density lipoprotein).
High levels can reflect genetics, diet, or thyroid issues, while low levels can reflect an overactive thyroid, liver disease, or malnutrition. Sex hormones (testosterone and estrogen) also influence it.
HDL Cholesterol
Often called \"good\" cholesterol because HDL particles transport cholesterol from peripheral tissues and arterial walls back to the liver for excretion or recycling
The concentration of cholesterol carried within high-density lipoprotein particles.
Higher levels are protective for the heart, while low levels track with inactivity, excess weight, smoking, and insulin resistance. Levels can be influenced by sex hormones (testosterone and estrogen).
Triglycerides
The main form of fat your body stores for energy, made from dietary fat and excess carbohydrates.
The amount of fat circulating in the bloodstream.
High levels often follow excess calories, refined carbs, or alcohol and accompany metabolic problems, while low levels are generally fine. Eating before the draw is the usual cause of a falsely high result.
LDL Cholesterol
Often called bad cholesterol because it is the form most linked to artery plaque. It is usually a calculated value rather than measured directly.
The cholesterol content within LDL particles.
High levels raise cardiovascular risk and can be genetic or diet-driven, while low levels are usually favorable. A non-fasting sample can underestimate it.
Total Cholesterol to HDL Ratio
A calculated risk score comparing your total cholesterol to your protective HDL, total cholesterol divided by HDL.
The proportion of total cholesterol relative to HDL cholesterol.
Conditions associated with elevated ratio include metabolic syndrome, obesity, diabetes, sedentary lifestyle, smoking, and familial dyslipidemias. An unfavorable ratio signals increased cardiovascular risk even when individual lipid values appear borderline.
LDL/HDL Ratio
A calculated comparison of your LDL to your protective HDL, LDL divided by HDL.
The proportion of LDL cholesterol relative to HDL cholesterol.
Elevated ratios are associated with increased atherogenic burden and cardiovascular risk. Conditions elevating this ratio mirror those affecting its components: familial hypercholesterolemia, metabolic syndrome, diabetes, obesity, hypothyroidism, sedentary lifestyle, smoking.
Non HDL Cholesterol
A calculated number capturing all the cholesterol that can form plaque, found by subtracting HDL from your total cholesterol.
The combined cholesterol in every plaque-forming particle, including LDL, VLDL, and lipoprotein(a).
A high result means more plaque-forming cholesterol in circulation and greater cardiovascular risk, while a low result is favorable.
HDL P
A measurement of the total concentration of low-density lipoprotein particles circulating in the bloodstream, determined via nuclear magnetic resonance (NMR) spectroscopy, and represents the actual count of atherogenic particles rather than their cholesterol content.
The total number of HDL particles in circulation.
Higher numbers generally track with efficient cholesterol clearance and a favorable profile, while lower numbers may reflect weaker HDL function. Exercise and alcohol influence it.
HDL SIZE
The average size of your HDL particles, which reflects how mature they are.
The average diameter of your HDL particles.
A larger size means the particle has matured and taken on a full load of cholesterol out of your artery walls and carrying it back to the liver. Smaller particles are less mature and move less cholesterol.
LARGE HDL P
The number of large, mature HDL particles that have taken on a full load of cholesterol.
Serum concentration of large HDL particles reflects the population of fully matured HDL capable of delivering cholesterol to the liver for excretion.
Higher numbers suggest efficient cholesterol clearance, while lower numbers may reflect weaker HDL maturation.
LARGE VLDL P
The number of large, triglyceride-rich VLDL particles, which are linked to insulin resistance.
Reflects hepatic triglyceride secretion and the population of triglyceride-rich lipoproteins.
Elevated numbers point to insulin resistance and added cardiovascular risk, while lower numbers are favorable. Refined carbs and alcohol raise them.
LDL P
The number of LDL particles in your blood, often a better gauge of risk than LDL cholesterol alone.
The total number of LDL particles in circulation.
High numbers raise cardiovascular risk and track with insulin resistance, while low numbers are favorable. This can flag risk even when LDL cholesterol looks normal.
LDL SIZE
LDL size is a measurement of the average diameter of LDL particles expressed in nanometers, determined via NMR spectroscopy, distinguishing between larger, more buoyant particles and smaller, denser particles.
The average diameter of your LDL particles.
Larger particles are considered more favorable, while smaller, denser particles track with insulin resistance and high triglycerides. Particle number still matters more than size.
SMALL LDL P
The number of small, dense LDL particles, the subset most able to lodge in artery walls.
The number of small LDL particles in circulation.
Elevated numbers point to insulin resistance and higher cardiovascular risk, while lower numbers are favorable. Carb intake and triglycerides drive them.
VLDL SIZE
The average size of your VLDL particles, the triglyceride-rich particles your liver makes as precursors to LDL particles.
The average diameter of your VLDL particles.
Larger particles suggest the liver is exporting more triglycerides, often with insulin resistance, while smaller particles reflect lower triglyceride content.
Homocysteine
A sulfur-containing amino acid intermediate produced during methionine metabolism that builds up when you are short on certain B vitamins.
The level of homocysteine in your blood, a functional sign of B-vitamin status.
High levels often signal B6, B12, or folate shortfalls and are tied to cardiovascular risk, while low levels are not a concern. Kidney function and age also raise it.
Apolipoprotein A1
The main protein in protective HDL particles.
The level of Apo A1 in your blood, reflecting your HDL\'s protective capacity.
Higher levels are generally associated with favorable cardiovascular profiles and Low levels may indicate increased cardiovascular disease risk, Apo A-1 status can be influenced by sex (higher in females), exercise (increases levels), alcohol consumption, smoking (decreases levels), estrogen status, and lipid-modifying medications.
Apolipoprotein B
The protein found on every plaque-forming particle, with one per particle, making it a direct count of harmful particles.
Represents the total number of potentially atherogenic particles in circulation, providing a single measurement that captures all particles capable of penetrating arterial walls and initiating atherosclerosis.
High levels indicate a heavy burden of harmful particles and raised cardiovascular risk, while low levels are favorable. Often more telling than LDL cholesterol alone.
Apolipoprotein B/A1 Ratio
A calculated balance between atherogenic particles (Apo B) and anti-atherogenic HDL particles (Apo A-1) into a single metric that may provide superior cardiovascular risk stratification compared to traditional lipid ratios.
The ratio of Apo B to Apo A1.
A high ratio signals an unfavorable balance and higher cardiovascular risk, while a lower ratio is favorable.
hs CRP
A sensitive marker of low-grade inflammation in the body, used to gauge heart risk.
The general level of inflammation in the body.
Levels above 3 mg/L suggest higher cardiovascular risk, while readings above 10 usually point to active infection or injury. Levels under 1 are reassuring. Obesity, smoking, and infection raise it.
Electrolyte Balance Electrolytes 5 markers Markers governing fluid balance, nerve, and muscle function.

Sodium
An electrolyte that plays a central role in maintaining fluid balance, blood pressure, and proper nerve and muscle function
Sodium concentration in blood, reflecting the balance between sodium intake, fluid intake, and kidney excretion.
High levels almost always mean dehydration, while low levels can come from overhydration, diuretics, or heart, liver, and hormonal problems.
Potassium
An electrolyte essential for muscle contraction (including heart muscle), nerve transmission, and moving nutrients into cells.
The concentration of potassium in the blood.
High levels are dangerous and can disturb heart rhythm, often from kidney issues or certain blood pressure drugs, while low levels cause weakness and commonly follow diuretics, vomiting, or diarrhea.
Chloride
An electrolyte that works with sodium and potassium to maintain fluid balance, blood pressure, and acid-base balance.
Chloride concentration in blood.
High levels usually mirror dehydration or acid buildup, while low levels often follow prolonged vomiting.
Carbon Dioxide
A measure of bicarbonate in your blood, which buffers your acid-base balance.
The acid-base status of your blood
High levels suggest too much base, sometimes from vomiting or lung disease, while low levels suggest too much acid, as in kidney disease or a diabetic emergency.
Calcium
The body\'s most abundant mineral, essential for bones, muscle, and nerves.
The total calcium in your blood, including the free form and the part bound to proteins.
High levels most often trace to overactive parathyroid glands or cancer, while low levels can come from vitamin D deficiency, kidney failure, or low albumin. Low protein can make it read falsely low.
Hormonal Balance Hormones 10 markers Markers tracking endocrine signalling across reproductive and stress hormones.

Total Testosterone (Uncapped, LCMS)
A hormone which regulates sex drive, erectile function, sperm production, muscle mass, bone density, red blood cell production, fat distribution, and mood.
Both the bound and free portions. LC-MS/MS separates testosterone from similar compounds before quantifying it by molecular mass, eliminating cross hormone reactivity interference and providing reliable results across the entire measurable range.
Low levels can mean reduced production from the testes, pituitary, or aging, while high levels can reflect hormone therapy or, in women, conditions such as PCOS.
Free Testosterone (Dialysis, not calculated)
The unbound fraction of testosterone circulating in blood (typically less than 2–3% of total testosterone). Only the free fraction can enter cells and exert biological effects, making it the \"active\" form.
The actual amount of \"bioavailable\" hormone currently ready to work on the body\'s tissues (muscle, brain, libido).
Low free testosterone is the most reliable sign of low-T symptoms, even when total testosterone looks normal. High levels usually reflect testosterone therapy or, in women, PCOS. A man can have \"normal\" Total Testosterone but feel terrible because high SHBG (a carrier protein) is locking it up, leaving his Free Testosterone low.
DHEA - S
An adrenal hormone that serves as a raw material your body converts into other sex hormones.
The level of DHEA-S in your blood, reflecting adrenal output.
Elevated levels in women can cause acne, hair loss, and facial hair growth (PCOS); in men, it typically causes no symptoms but may indicate adrenal tumors. High levels in women can drive acne and unwanted hair growth, as in PCOS, while low levels track with aging, fatigue, and low libido in men and women.
SHBG
A protein made by the liver that binds testosterone and estrogen and controls how much stays free for your body to use.
How much of your testosterone is being held bound versus left free.
High levels leave less testosterone available and rise with aging, thyroid, or liver issues, while low levels free up more testosterone and track with excess weight, diabetes, and insulin resistance.
PSA Total
A protein made by the prostate, used to screen for prostate problems.
The total level of PSA in your blood.
Elevated levels may indicate Benign Prostatic Hyperplasia (BPH), infection (prostatitis), or prostate cancer. TRT can cause mild elevations. Low levels are normal; however, 5-alpha reductase inhibitors (Finasteride/Dutasteride) artificially lower results by ~50%.
Estradiol (Ultra Sensitive, LCMS)
The main estrogen in the body, important for the menstrual cycle, bone strength, mood, and libido in both sexes.
The serum concentration of estradiol (E2) with high precision across the full physiological range, including the low levels found in men, children, and postmenopausal women.
High levels in men cause gynecomastia, fluid retention, and emotional volatility; in women, it indicates the ovulation phase or estrogen dominance. Low levels in men cause joint pain, osteoporosis, and low libido; in women, it indicates menopause or amenorrhea, and also osteoporosis..
LH
A pituitary hormone that drives testosterone production in men and triggers ovulation in women.
The level of LH in your blood, reflecting how your pituitary and gonads are communicating.
High levels point to the gonads failing to respond, while low levels point to infertility due to a pituitary or hypothalamic problem and can follow anabolic steroid use.
FSH
A pituitary hormone central to sperm production in men and egg development in women.
The level of FSH in your blood, reflecting pituitary and gonadal status.
High levels suggest the ovaries or testes are failing, as in menopause or diminished reserve, while low levels point to a pituitary issue. Cycle phase and age move it.
Progesterone (Ultrasensitive, LCMS)
A steroid hormone produced following ovulation and by the placenta during pregnancy, responsible for preparing the uterine lining for embryo implantation and maintaining early pregnancy. In men, it is produced in small amounts by the adrenal glands and testes, serving as a precursor in steroid hormone synthesis pathways.
The level of progesterone in your blood.
High levels indicate ovulation confirmed (luteal phase), pregnancy, ovarian cysts, congenital adrenal hyperplasia, certain ovarian tumors. Low levels can indicate anovulation, luteal phase deficiency (associated with recurrent miscarriage), threatened miscarriage, ectopic pregnancy
IGF-1
A polypeptide hormone structurally similar to insulin that mediates many growth hormone (GH) effects, playing essential roles in tissue growth, metabolic regulation, and cellular proliferation throughout life.
The level of IGF-1 in your blood, a stable stand-in for growth hormone.
High levels can point to excess growth hormone, while low levels can reflect growth hormone deficiency, poor nutrition, or liver issues. It naturally declines with age.
Immune & Inflammation Immune 11 markers Markers reflecting immune cell counts and underlying inflammatory tone.

White Blood Cells
The cells of your immune system that fight infection.
The total number of white blood cells in your blood.
High counts usually signal infection, inflammation, or stress, while low counts can mean a virus, an autoimmune issue, or suppressed bone marrow. Exercise, smoking, pregnancy, and time of day shift it.
Absolute Neutrophils
A calculated count of neutrophils, the white blood cells that fight bacteria (white cell count multiplied by the neutrophil percentage).
How many neutrophils you have available to fight infection.
High counts usually mean a bacterial infection, stress, or inflammation, while low counts leave you more open to infection and can follow viral illness, chemotherapy, or marrow problems.
Absolute Lymphocytes
A calculated count of lymphocytes, the white blood cells that handle viruses and long-term immunity.
How many lymphocytes are circulating in your blood.
High counts often point to a viral infection, while low counts can come from steroids, severe stress, malnutrition, or HIV.
Absolute Monocytes
A calculated count of monocytes, the white blood cells that clean up after an infection.
How many monocytes are circulating in your blood.
High counts suggest chronic infection, autoimmune disease, or recovery from a recent illness, while low counts are uncommon and tend to follow stress or marrow suppression.
Absolute Eosinophils
A calculated count of eosinophils, the white blood cells tied to allergies and parasites.
How many eosinophils are circulating in your blood.
High counts usually mean an allergic reaction or parasitic infection, while low counts often reflect stress or steroid use. They run lower in the morning.
Absolute Basophils
A calculated count of basophils, the rarest white blood cells, involved in allergic responses.
How many basophils are circulating in your blood.
High counts are unusual and can signal chronic inflammation, thyroid issues, or marrow disorders. Low or zero counts are normal.
Neutrophils
The white blood cells that are your main defense against bacterial and fungal infections.
The relative percentage of neutrophils compared to the total number of white blood cells in circulation.
A high percentage points to bacterial infection, inflammation, or stress, while a low percentage often appears during viral infections as other cells rise.
Lymphocytes
The white blood cells at the center of your immune system, including the cells that make antibodies and attack infected cells.
The share of your white blood cells that are lymphocytes.
A high percentage usually means a viral infection, while a low percentage tracks with bacterial infection, stress, or steroids. It moves opposite the neutrophil percentage.
Monocytes
The largest white blood cells, which clear away debris and fight certain long-running infections.
The percentage of the total white blood cell count that consists of monocytes.
A high percentage often appears during recovery from infection or in chronic inflammation, while a low percentage carries little meaning on its own.
Eosinophils
The white blood cells that respond to allergies and parasites.
The percentage of the total white blood cell count that consists of eosinophils.
A high percentage strongly suggests an allergic response or parasite, while a low percentage is usually unremarkable.
Basophils
The rarest white blood cells, which release histamine during allergic reactions.
The percentage of the total white blood cell count that consists of basophils.
A high percentage is uncommon and can reflect chronic inflammation or thyroid issues. Zero is a normal everyday result.
Renal Function Snapshot Kidney 4 markers Markers that estimate filtration, waste handling, and hydration balance.

Urea Nitrogen (BUN)
A waste product your liver makes when it breaks down protein, cleared by your kidneys.
How well your kidneys are clearing this waste, along with your hydration.
High levels suggest impaired kidneys, dehydration, or a high-protein diet, while low levels can mean liver disease, low protein intake, or overhydration.
Creatinine
A waste product from the normal breakdown of muscle, cleared by your kidneys.
How well your kidneys are filtering, using a waste product more stable than BUN.
High levels suggest the kidneys aren\'t filtering well, while low levels usually just reflect low muscle mass. Heavy muscle or creatine supplements can raise it with no kidney problem present.
Glomerular filtration rate (GFR)
A calculated estimate of how well your kidneys filter your blood, based on your creatinine, age, and sex.
The actual flow rate of filtered fluid through the kidney, serving as an overall index of kidney function.
Low values indicate reduced kidney function and are the main measure for chronic kidney disease, while very high values can appear in early pregnancy or early diabetes. The estimate is less reliable at very high or very low muscle mass.
BUN/Creatinine Ratio
A calculated ratio comparing blood urea nitrogen to creatinine.
Because the kidneys handle these two waste products differently, the ratio helps distinguish between causes of abnormal kidney markers.
A high ratio points to dehydration, heart failure, or GI bleeding, while a low ratio can reflect liver disease or muscle breakdown.
Hepatic Function Panel Liver 8 markers Markers reflecting liver enzyme activity and metabolic clearance.
Protein, Total
The combined amount of your two main blood proteins, albumin and globulin.
Overall protein status, reflecting liver synthetic function, nutritional status, and immune system activity.
High levels can reflect chronic inflammation, infection, or a marrow disorder, while low levels often point to liver disease, kidney loss, or poor nutrition. Dehydration falsely raises it.
Albumin
The most abundant protein in blood plasma, made by the liver. It keeps fluid from leaking out of blood vessels into tissues and carries hormones, vitamins, enzymes, and medications throughout your body.
The concentration of albumin, serving as a primary marker of liver synthetic function and nutritional status.
Low levels suggest liver disease, kidney loss, inflammation, or malnutrition, while high levels almost always just mean dehydration. It reflects longer-term status rather than a single day.
Globulin
Globulins are a group of proteins made by the liver and immune system. They include alpha and beta globulins (transport proteins) and gamma globulins (immunoglobulins/antibodies).
Immune system activity and certain aspects of liver function.
The calculated difference between Total Protein and Albumin. High levels suggest chronic infection, autoimmune disease, or certain blood cancers, while low levels can signal kidney disease or weak immunity.
Albumin/Globulin Ratio
A calculated ratio comparing albumin levels to globulin levels in blood.
The balance between albumin and globulin production, reflecting liver function, immune activity, and overall protein status.
A low ratio points to either low albumin or high globulin and is a general signal of illness, while a high ratio is less common and can reflect low antibody production or dehydration.
Bilirubin, Total
A yellow pigment made when red blood cells break down, processed and cleared by the liver.
The level of bilirubin in your blood, reflecting liver function, bile flow, and red cell turnover.
High levels can cause jaundice and point to liver damage, bile duct blockage, or rapid red cell breakdown. A common harmless genetic trait, Gilbert syndrome, raises it mildly with fasting or illness. Low levels are generally not a clinical concern.
Alkaline Phosphatase
An enzyme found mainly in the liver, bile ducts, and bones.
The activity of the ALP enzyme in the blood, reflecting liver and biliary tract function, as well as bone activity.
High levels suggest bile duct blockage or active bone turnover, while low levels are rare and can reflect certain nutrient deficiencies.
Aspartate Aminotransferase (AST)
An enzyme found in the liver, heart, and muscle that leaks into the blood when those tissues are damaged.
The level of AST enzyme, serving as a marker for cellular injury.
High levels point to liver injury or muscle strain. Intense exercise alone can raise it with no liver problem. Low levels are not clinically significant but can be associated with Vitamin B6 deficiency.
Alanine transaminase (ALT)
An enzyme concentrated in the liver, making it a more specific sign of liver injury than AST.
The level of ALT in your blood, which rises when liver cells are damaged.
High levels commonly reflect fatty liver, hepatitis, alcohol, or medication effects, while low levels are normal. Hard workouts can nudge it up.
Metabolic Health Metabolic 5 markers Markers tied to insulin sensitivity, glycemic control, and energy metabolism.

Glucose
The sugar your body uses as its main source of energy, drawn mostly from the carbohydrates you eat.
The amount of sugar in your blood, measured after fasting for a baseline reading.
High levels point toward prediabetes or diabetes, though stress and some medications raise it too, while low levels can come from too much insulin, fasting, or liver and adrenal issues.
Insulin
The hormone your pancreas makes to move sugar out of your blood and into your cells.
The amount of insulin circulating in the blood while fasting.
High fasting levels are an early warning of insulin resistance, often years before blood sugar rises, while low levels suggest the pancreas is struggling to keep up. Eating before the draw changes the result.
Hemoglobin A1c
A measure of how much sugar has attached to your hemoglobin. Because red blood cells live about three months, it reflects your average blood sugar over that span.
Your average blood sugar level over the past 2–3 months.
High levels indicate sustained high blood sugar and raise long-term risk to the heart, nerves, kidneys, and eyes. Low levels are uncommon. Anemia or a recent transfusion can skew it.
Uric Acid
A waste product from the breakdown of purines, compounds found in food and your own cells.
The concentration of uric acid in the blood.
High levels can cause gout and kidney stones and track with metabolic problems, while low levels are uncommon and can follow certain medications or liver issues. Alcohol, fructose, and diet move it.
Cortisol, Total
A glucocorticoid hormone produced by the adrenal cortex, essential for stress response, glucose metabolism, immune modulation, and circadian rhythm regulation, with secretion controlled by the hypothalamic-pituitary-adrenal (HPA) axis.
The level of cortisol in your blood, with levels exhibiting pronounced diurnal variation where it is highest in early morning and declining throughout the day.
High levels can come from stress, Cushing syndrome, or steroid medications, while low levels can signal adrenal insufficiency.
Nutrient Status Nutrients 19 markers Markers that reveal how vitamin and mineral stores are tracking.

Vitamin D2
The liver metabolite of vitamin D2, a form of vitamin D that comes exclusively from plant/fungal dietary sources or supplements.
The concentration of vitamin D2 circulating in the blood, which reflects recent dietary intake of D2-fortified foods or ergocalciferol supplementation.
Elevated levels indicate excessive D2 supplementation and may contribute to toxicity if total vitamin D is significantly raised. In unsupplemented individuals, undetectable D2 is normal and expected; in patients on D2 therapy, low levels may indicate malabsorption.
Vitamin D3
The liver metabolite of cholecalciferol (vitamin D3), the primary form of vitamin D in humans, produced endogenously in the skin upon ultraviolet B exposure.
The level of vitamin D3 in your blood, reflecting sun exposure, diet, and any D3 supplements.
High levels point to heavy supplementation or sun exposure and can push calcium too high, while low levels reflect too little sun, poor intake, or absorption trouble. Skin tone, weight, and age all shift it.
Vitamin D Total
The sum of 25-hydroxyvitamin D2 and 25-hydroxyvitamin D3, representing the body\'s total vitamin D stores; this is the primary circulating form of vitamin D and the best indicator of overall vitamin D status.
The combined serum concentration of both D2 and D3 metabolites, reflecting total vitamin D obtained from sun exposure, diet, and supplementation.
Low levels mean deficiency, which weakens bones over time, while very high levels usually come from over-supplementing and can raise calcium uncomfortably. Sun, diet, weight, and gut or kidney health all influence it.
Ferritin
A protein that stores iron inside your cells. The small amount in your blood reflects how much iron your body holds in reserve.
The level of ferritin in your blood, used as a stand-in for your total iron stores.
A low result is often the first sign your iron is running out, before tiredness or anemia set in. A high result can mean too much iron, though inflammation, infection, or liver issues can raise it on their own, so it is read alongside your other iron markers.
Arachidonic Acid (AA)
An omega-6 polyunsaturated fatty acid that serves as the primary precursor for pro-inflammatory eicosanoids (prostaglandins, thromboxanes, leukotrienes) and is abundant in cell membranes.
The level of arachidonic acid in your red blood cell membranes.
Elevated arachidonic acid may indicate pro-inflammatory status, high dietary omega-6 intake, or imbalance in the omega-6 to omega-3 ratio. Low levels can reflect low fat intake or high omega-3 intake.
AA/EPA Ratio
A calculated balance between a pro-inflammatory omega-6, arachidonic acid, and an anti-inflammatory omega-3, EPA.
The ratio of arachidonic acid to EPA.
Elevated AA/EPA ratio indicates omega-6 predominance and a pro-inflammatory fatty acid profile, associated with increased cardiovascular and inflammatory disease risk. Lower ratios indicate favorable omega-3 to omega-6 balance with greater anti-inflammatory capacity.
Docosahexaenoic acid (DHA)
Docosahexaenoic acid (DHA) is an omega-3 polyunsaturated fatty acid concentrated in brain, retinal, and cardiac tissues, essential for neurodevelopment, cognitive function, and cell membrane fluidity.
The level of DHA in your red blood cell membranes, reflecting intake over the past few months.
Higher DHA levels are associated with cognitive benefits, reduced inflammation, and cardiovascular protection. Low DHA levels may indicate insufficient omega-3 intake and are associated with cognitive decline risk, depression, and cardiovascular disease.
Docosapentaenoic acid (DPA)
An omega-3 polyunsaturated fatty acid that serves as an intermediate in the metabolic pathway between EPA and DHA, with emerging evidence suggesting independent cardiovascular and anti-inflammatory benefits.
Red blood cell membrane DPA concentration, expressed as a percentage of total fatty acids, reflects omega-3 intake and the body\'s metabolic handling of marine-derived omega-3 fatty acids.
Higher DPA levels may provide additional anti-inflammatory and cardiovascular benefits beyond EPA and DHA alone. Low DPA levels typically parallel low EPA and DHA status.
Eicosapentaenoic acid (EPA)
An omega-3 polyunsaturated fatty acid obtained primarily from marine sources (fatty fish, fish oil, algae) that serves as a precursor to anti-inflammatory eicosanoids and resolvins.
Red blood cell membrane EPA concentration, expressed as a percentage of total fatty acids, reflects long-term dietary omega-3 intake and tissue incorporation over the preceding 2–3 months.
Higher EPA levels are associated with reduced inflammation, lower triglycerides, and cardiovascular protection. Low EPA levels may indicate insufficient omega-3 intake and are associated with elevated inflammatory markers and cardiovascular risk.
EPA+DPA+DHA
A calculated total of your three main omega-3 fats (EPA, DPA, and DHA) as a percentage of your red cell membranes.
This combined measurement reflects tissue-level omega-3 fatty acid incorporation over the preceding 2–3 months, providing a more stable indicator of omega-3 status than plasma measurements which fluctuate with recent dietary intake.
Higher Omega-3 Index levels (8–12%) are associated with cardioprotection, reduced sudden cardiac death risk, improved cognitive outcomes, and anti-inflammatory benefits. Low Omega-3 Index (<4%) is associated with elevated cardiovascular risk.
Linoleic acid (LA)
An essential omega-6 polyunsaturated fatty acid that cannot be synthesized by humans and must be obtained from dietary sources, primarily vegetable oils, nuts, and seeds.
The level of linoleic acid in your red blood cell membranes.
High levels point to heavy vegetable oil intake and a possible imbalance with omega-3, while very low levels are rare. Driven by oils, nuts, and processed foods.
Omega-3 Total
Total omega-3 measures the combined concentration of all omega-3 polyunsaturated fatty acids (ALA, EPA, DPA, DHA, and others) in red blood cell membranes.
Your combined omega-3 level.
Higher total omega-3 status is associated with anti-inflammatory benefits and cardiovascular protection. Low total omega-3 indicates insufficient intake of both plant-based (ALA) and marine-derived (EPA, DHA) omega-3 sources.
Omega-6 Total
The combined concentration of all omega-6 polyunsaturated fatty acids (linoleic acid, arachidonic acid, and others) in red blood cell membranes.
Your combined omega-6 level.
High total omega-6 may indicate excessive vegetable oil consumption and unfavorable balance relative to omega-3 intake. Low omega-6 is uncommon in Western populations given ubiquitous presence in processed foods.
Omega-6/Omega-3 Ratio
A calculated balance between your inflammatory omega-6 fats and your anti-inflammatory omega-3 fats.
This ratio reflects the competitive relationship between pro-inflammatory omega-6 and anti-inflammatory omega-3 fatty acids.
Elevated ratios are associated with increased inflammatory disease risk, cardiovascular disease, and chronic conditions. Lower ratios (4:1 or less) are associated with reduced cardiovascular and inflammatory disease risk.
Vitamin B12 (cobalamin)
A water-soluble vitamin essential for DNA synthesis, red blood cell formation, neurological function, and is obtained exclusively from animal-derived foods or supplementation.
The level of B12 in your blood, though serum levels may not fully reflect tissue status in all cases.
Low levels can come from poor intake, especially vegan diets, absorption problems, or long-term use of certain medications. High levels usually reflect supplements but can occasionally signal liver or kidney issues.
Vitamin B9 (Folate)
A water soluble B vitamin your body needs to make red blood cells and DNA. with the natural form found in foods and the synthetic form (folic acid) used in fortification and supplements.
Serum folate concentration reflects recent dietary intake and circulating folate status, though red blood cell folate provides a more stable indicator of tissue stores over time.
Low levels can come from poor diet, alcohol, or pregnancy demands, while high levels usually reflect recent intake and can mask a B12 deficiency. Serum levels swing with recent meals.
Iron % Saturation
A calculated value showing how much of your iron-carrying capacity is filled, serum iron compared with total capacity.
This percentage reflects the balance between iron supply and transport capacity, providing context for interpreting serum iron and TIBC values in diagnosing iron disorders.
High saturation can point to iron overload or hemochromatosis, while low saturation alongside low iron and high binding capacity points to iron deficiency. Recent meals and timing affect it.
Total Iron Binding Capacity (TIBC)
Total iron-binding capacity (TIBC) measures the maximum amount of iron that serum proteins (primarily transferrin) can bind, reflecting the blood\'s total capacity to transport iron.
TIBC indirectly reflects transferrin concentration and indicates the reserve capacity for iron transport, with the relationship between TIBC and serum iron used to calculate percent saturation.
High capacity often signals iron deficiency, as the body makes more transporter, while low capacity can reflect chronic disease, malnutrition, or iron overload.
Iron, Total
The iron currently circulating in your blood, in transit between absorption, storage, and use.
The level of iron in your blood right now.
High levels can mean overload or excess supplementation, while low levels point to deficiency or blood loss.
Thyroid Axis Thyroid 6 markers Markers that show how your thyroid is signalling and producing hormones.

TSH
A hormone produced by the pituitary gland that tells your thyroid gland when to produce and release thyroid hormones (T4 and T3).
The level of TSH in your blood, the main screening test for thyroid problems.
High levels usually mean an underactive thyroid, while low levels usually mean an overactive one or overmedication. It runs highest in the early morning, and biotin supplements can distort it.
Reflex Free T4* (not included in total marker count)
The active, unbound form of the thyroid hormone T4, run automatically when your TSH comes back abnormal.
The concentration of unbound, biologically active thyroxine. *If TSH is abnormal, Free T4 is automatically performed on the same sample.
High levels point to an overactive thyroid, while low levels point to an underactive one. Biotin and several medications can shift the reading.
Free T4
The biologically active fraction of T4 hormone that is not bound to carrier proteins;
The concentration of unbound, biologically active thyroxine.
High levels point to an overactive thyroid, while low levels point to an underactive one. Biotin and several medications can shift it.
T3 Free
The metabolically active and most potent thyroid hormone responsible for regulating cellular metabolism, thermogenesis, and energy expenditure
The level of active, unbound T3 available to your tissues.
High levels suggest an overactive thyroid or overmedication, while low levels suggest an underactive thyroid or poor conversion from T4, sometimes from stress or nutrient gaps.
Thyroid Peroxidase
An antibody that shows your immune system is attacking an enzyme your thyroid needs to make hormone.
The concentration of antibodies targeting thyroid peroxidase, reflecting autoimmune activity against the thyroid gland.
Elevated levels indicate Hashimoto\'s thyroiditis, Graves’ disease, postpartum thyroiditis, increased risk of thyroid dysfunction progression, associated with other autoimmune conditions. Low or undetectable levels are normal and indicate no autoimmune attack is present.
Thyroglobulin antibodies
An antibody that attacks thyroglobulin, a protein used by the thyroid gland to store iodine and produce hormones.
The concentration of antibodies targeting thyroglobulin protein, reflecting autoimmune thyroid activity.
Elevated levels are found in Hashimoto’s Thyroiditis and Graves’ disease; they are also used to monitor thyroid cancer patients. Low or undetectable levels are normal.


Comprehensive
Diagnostic Testing
No monthly memberships.
Entry
- Testosterone (LC-MS/MS), vitamin D, thyroid, metabolic panel, lipids, CBC + more.
- Clinically sufficient for GLP-1 protocols, metabolic optimization, and non-hormonal therapies
- Everything you need to get started
- Accessible pricing without cutting corners
Complete
- Entry + full thyroid panel (T3, T4, antibodies), estradiol (LC-MS/MS), LH, FSH, progesterone (LC- MS/MS) + more.
- Clinically sufficient for all protocols including TRT, HRT, and all hormonal therapies
- Complete hormone workup that reveals both what's off and why
- The ideal balance of depth and value for serious optimization
Premium
- Complete + IGF-1, cortisol, NMR lipid fractionation, ApoAl/ApoB, hs-CRP, homocysteine, omegas, B12/folate + more.
- Every system tracked
- Nothing left unmeasured
- The most comprehensive panel we offer
*AT-HOME BLOOD DRAW AVAILABLE FOR A FEE, STARTING AT $99. PRICING VARIES BY ZIP CODE.
WHAT WE SPECIALIZE IN
Distinct programs for men and women, each built around different needs
From intake to treatment in four steps.
No monthly subscriptions or hidden fees.

Online Assessment
Complete a brief intake covering your health history, current symptoms, and what you are looking to address.

Lab Testing
Select one of our blood work panels and complete your draw at a Quest location near you, or send us labs from the last 3 months. At-home draws are available for an added fee.

Provider Consultation
Your licensed medical provider reviews your results, explains what they mean, and builds your treatment plan for you.

Start Treatment
If treatment is clinically appropriate, your provider prescribes through one of our licensed partner pharmacies and your medications ship directly to your home.
Learn More
Expert insights and educational resources
No blog posts selected. Please select posts in the element settings.
PATIENT REVIEWS






*Patient experiences reflect individual perspectives and are shared with permission. They describe personal impressions of care and are not a prediction of any individual’s medical results.